480 rub. | 150 UAH | $7.5 ", MOUSEOFF, FGCOLOR, "#FFFFCC",BGCOLOR, "#393939");" onMouseOut="return nd();"> Dissertation - 480 RUR, delivery 10 minutes, around the clock, seven days a week and holidays
Kaisheva, Anna Leonidovna. Mass spectrometric identification of proteins and protein complexes on atomic force microscope chips: dissertation... Candidate of Biological Sciences: 01/03/04 / Kaisheva Anna Leonidovna; [Place of protection: Scientific research. Institute of Biomed. chemistry named after V.N. Orekhovich RAMS]. - Moscow, 2010. - 104 p.: ill. RSL OD, 61 10-3/1308
Introduction
Chapter 1. Literature Review 10
1.1. Analysis of scientific and technical progress in the field of highly sensitive proteomic technologies
1.2 Characteristics of the hepatitis C virus 20
1.2.1 Methods for diagnosing hepatitis C 22
1.2.2 Serological protein markers of hepatitis C 25
Chapter 2. Materials and methods 28
2.1 AFM chips 28
2.2 Protein preparations and reagents 29
2.3 AFM analysis 30
2.4 Preparation of samples for mass spectrometric analysis 31
2.5 Mass spectrometric analysis 33
2.5.1 MALDI-MS analysis of proteins on the surface of an AFM chip 33
2.5.2 ESI-MS analysis of proteins on the surface of an AFM chip 34
Chapter 3. Results and discussion 35
3.1 MS - identification of proteins caught using “chemical phishing” on the surface of an AFM chip from an analyte solution
3.2 MS identification of proteins biospecifically captured on the surface of an AFM chip from an analyte solution
3.3 MS identification of proteins on the surface of an AFM chip, biospecifically captured from blood serum samples
Conclusion 83
Literature
Introduction to the work
Relevance of the work.
One of the priority areas in modern biochemistry is the creation of effective analytical methods for proteomic analysis, the main task of which is to detect and inventory the body’s proteins, study their structure, functions, and identify protein interactions. Solving this problem will make it possible to create new systems for diagnosing diseases and their treatment. Standard methods of modern proteomic analysis are based on the separation of multicomponent protein mixtures using chromatography, electrophoresis in combination with mass spectrometric methods (MS) for protein identification. Despite the undoubted advantages of standard MS analysis in terms of speed and reliability of identification of protein molecules, it has significant limitations in its use due to low
concentration sensitivity of the analysis at the level of 10" "10" M and a high dynamic range of protein content in biological material. At the same time, the overwhelming number of functional proteins, including biomarkers of such socially significant diseases as viral hepatitis B and C, tumor markers, etc. ., are present in blood plasma in the concentration range of 10" Mi less.
One of the ways to overcome this methodological limitation of the concentration sensitivity of the analysis is to use biomolecular detectors, which make it possible to register single molecules and their complexes and theoretically have no limitations in concentration sensitivity. Biomolecular detectors include detectors based on nanotechnology devices, such as atomic force microscopes (AFM), nanowire detectors, nanopores and a number of other detectors. The unique sensitivity of AFM detectors makes it possible to visualize individual protein molecules and count their number. When using AFM as a biomolecular detector, it is necessary to use special chips that make it possible to concentrate biological analyte macromolecules from a large volume of incubation solution on a limited surface of the chip. The protein objects under study can be concentrated on the surface of the chip both due to physical or chemical adsorption, and due to biospecific interactions (AFM-biospecific phishing).
However, in practice, a limitation of the use of AFM-based nanodetectors is that despite the ability to visualize individual protein molecules on the surface of a chip, such detectors are not able to identify them, which is especially important in the study of complex protein mixtures, including biological material. Therefore, the development of an analysis method that complements the capabilities of the AFM method seems to be an urgent task. To date, the only proteomic method that allows unambiguous and reliable identification of protein molecules is MS analysis. The dissertation work developed an approach that combines the high sensitivity of the AFM method and reliable MS identification for the detection of proteins and their complexes from an analyte solution.
Purpose and objectives of the study.
The purpose of this work was the mass spectrometric identification of proteins and protein complexes identified in biomaterials using atomic force microscopy.
To achieve this goal, the following tasks were solved:
A scheme for MS identification of proteins caught on the surface of an AFM chip using chemical or biospecific phishing has been developed;
Conditions for enzymatic hydrolysis of proteins on the surface of an AFM chip for subsequent MS identification have been developed;
MS identification of model proteins on the surface of an AFM chip was carried out;
MS identification of proteins on the surface of an AFM chip, biospecifically captured from a multicomponent mixture (serum), was carried out.
Scientific novelty of the work .
The dissertation developed a scheme that allows for MS identification of proteins and protein complexes captured from a solution or multicomponent mixture on the surface of an AFM chip. For this purpose, optimal sample preparation conditions were selected, including the hydrolysis mode (temperature, humidity, composition of the trypsinolytic mixture, trypsinolysis time) of protein molecules covalently and non-covalently immobilized on the surface of the AFM chip. The peculiarity of this work was that, in comparison with standard proteomic protocols for enzymatic hydrolysis, the preparation of samples for MS analysis was carried out not in solution, but in a limited area
chip surface. The developed scheme made it possible to effectively carry out MS analysis and identify both individual proteins and protein complexes on the surface of the AFM chip. MS analysis of proteotypic peptides of the studied proteins was carried out using two types of ionization (MALDI And EST) and two types of detectors (time-of-flight and ion trap). The developed scheme for coupling AFM-biospecific phishing and MS was also successfully tested for the detection of protein markers of hepatitis C virus (HCV) (HCVcoreAg and E2) in blood serum samples.
Practical significance of the work .
The results of this work make it possible to create highly sensitive proteomic methods without the use of labels and additional sample preparation procedures for the detection of proteins found in low concentrations in biological material, including blood serum. An approach based on atomic force microscopy and mass spectrometry has been proposed, which will allow the detection and identification of protein markers of the hepatitis C virus in human blood serum.
The approach can be used in developments aimed at creating new diagnostic chips and searching for biomarkers of a wide range of socially significant diseases.
Approbation of work.
The main results of the research were presented at the “1st, 2nd and 3rd International Forum on Nanotechnology” (Moscow, 2008-2010); “IV Congress of the Russian Society of Biochemists and Molecular Biologists”, Novosibirsk, 2008; at the International Congress “Human Proteome”, Amsterdam, 2008; at the International Human Proteome Congress, Sydney, 2010.
Publications.
Structure and scope of the dissertation.
The dissertation consists of an introduction, a literature review, a description of materials and research methods, research results and their discussion, a conclusion, conclusions and a list of references. The work is presented on 104 pages, illustrated with 33 figures and 4 tables, the bibliography consists of 159 titles.
Analysis of scientific and technical progress in the field of highly sensitive proteomic technologies
One of the priority areas in modern science is the discovery and elucidation of the role of various types of proteins in the body, as well as understanding the molecular mechanisms leading to the development of diseases.
Despite the continuous improvement of proteomic methods, the number of newly discovered disease biomarkers has remained virtually unchanged over the past decade. This is due to the fact that the concentration limit of detection of traditional proteomic methods does not exceed 10"9 M. At the same time, it is important for proteomics to develop new analytical approaches for identifying proteins of a lower concentration range, in particular low-copy protein molecules (with a concentration of 10"13 M and less), including biomarkers in biological material. Since it can be assumed that it is in these concentration ranges that protein markers of most diseases are located.
One of the actively developing areas, which makes it possible to slightly increase the concentration sensitivity of analysis, is the creation of analytical complexes based on nanochromatographic and nanoelectrophoretic systems compatible with mass spectrometers.
A nanochromatographic system in combination with mass spectrometry and electrospray ionization has made it possible to increase the sensitivity of protein detection by two orders of magnitude compared to high-resolution chromatography (HPLC). The limit of concentration sensitivity of such coupled systems is limited by the sensitivity of the electrophoresis/chromatography stage, and does not exceed 10-12 M for individual proteins (for example, for cytochrome C and bradykinin).
Currently, chromatographic methods have developed into separate independent areas - SELDI MS analysis (surface enhanced laser desorption and ionization/time of flight mass spectrometry), protein phishing methods using magnetic microparticles. In these technologies, the hydrophobic or charged surfaces of SELDI chips are... or magnetic microparticles in combination with mass spectrometric analysis are successfully used: for? identification - and identification as separate types; proteins, and for protein/peptide profiling of blood serum [c, 8; \Ъ, 15]. SEbDIi МЄ is a powerful approach that allows one to study a biomaterial through the adsorption of biomolecules (proteins, peptides) onto chemically activated? surface (cation/anion exchange chips) followed by mass spectrometric analysis of adsorbed: molecules:. SEEDPMЄ approach is applied; for protein profiling of biomaterial;. and recently: it began to be used as a “diagnostics based on proteomic barcodes” [17].. The essence of such “barcode diagnostics” is to identify? features of the protein profile of the biological sample; associated with a specific disease: So, it is known; what g at. In cancer diseases, the “proteomic barcode” of biomaterial differs significantly from that in healthy1 groups of individuals: Therefore, control over changes in protein; The composition of the biomaterial can become the basis for early diagnosis of diseases. On the; today, using the SELDI approach? MЄ markers were identified. stomach, ovarian, prostate, and breast cancer: The limitation of this method5 is the inability to identify proteins with high resolution and reliability, which is especially important when; analysis of multicomponent mixtures, such as biological material.
In addition to the problem of low concentration sensitivity of existing analytical systems, a stumbling block for proteomic analysis of biological material has become a wide dynamic range of protein concentrations, especially in blood serum, which varies from 1(G M down to individual protein molecules. High-copy (major) proteins interfere with such systems detection and identification of low-copy (minor) proteins.
The problem of a wide concentration range of proteins in a biomaterial can be solved by using methods of depletion of blood serum from major fractions of proteins, separation methods of multicomponent mixtures and nanotechnological methods based on biospecific and chemical fishing of protein analyte molecules from complex mixtures onto the surface of chips to various biosensors or onto an activated surface magnetic microspheres.
Traditionally, one-dimensional, more often two-dimensional, gel electrophoresis is used to separate multicomponent protein mixtures. The principle of protein separation by two-dimensional gel electrophoresis methods is based on the difference between proteins according to the values of their isoelectric points Hf molecular weights. In proteomics, these approaches are used for protein mapping of biomaterial (tissue, blood plasma, etc.). The combination of one-dimensional and/or two-dimensional electrophoresis with mass spectrometry allows the identification of separated and visualized proteins. However, the two-dimensional gel electrophoresis procedure is still not automated; it is quite complex and labor-intensive to perform, requires a highly qualified operator, and the analysis results are often poorly reproducible.
A more convenient procedure for separating proteins compared to two-dimensional electrophoresis is high-resolution chromatography (HPLC); which is an automated procedure that allows the removal of high-copy proteins from a complex mixture in order to subsequently identify low-copy proteins.
For the purpose of direct identification of proteins in complex mixtures, a chromatography column can be coupled to a mass spectrometer. However, intact proteins are practically not amenable to high-quality separation using HPLC, since they are denatured during analysis (due to low pH values of the environment and high concentrations of organic solvents), as well as due to the low accuracy of mass spectrometric analysis, therefore, direct identification of most intact proteins , especially with a molecular weight exceeding 10 kDa, is often impossible. The analytical accuracy of the measurement can be improved by hydrolytic cleavage of proteins into peptide fragments with a molecular weight of 700 to 4000 Da using proteases; such as trypsin (bottom-up technology). To achieve high-quality separation of proteins in a mixture, a combination of several chromatographic procedures is used, the so-called multidimensional chromatography.
Methods for diagnosing hepatitis
Currently, test systems for identifying anti-HCVcore are used for protein diagnostics of hepatitis C. The first ELISA tests detecting the presence of anti-HCVcore antibodies became available in the early 1990s, but they had low sensitivity and selectivity. Later, in the late 90s, a new generation of ELISA tests for anti-HCVcore appeared, which had a fairly high sensitivity of about 95-99% and could detect HCV several months after infection.
For example, in 1996, test systems developed by Vector-Best (Novosibirsk) and Diagnostic Systems (Nizhny Novgorod) to detect antibodies - anti-HCV IgM class - appeared on the Russian market. The role of IgM class antibodies in serodiagnosis has not been sufficiently studied, however, some studies have shown the importance of this marker for identifying chronic hepatitis C. It has also been established that the correlation between the detection of viral RNA and anti-HCV IgM in patients is 80-95%. To determine the phase of development of viral hepatitis C, Afanasyev A.Yu. et al. used a coefficient reflecting the ratio of anti-HCV IgG to anti-HCV IgM in the blood of patients. To date, many enzyme-linked immunosorbent assay (ELISA) systems have been developed that detect circulating antibodies to many epitopes of the hepatitis E virus.
Modern laboratory diagnostics of: viral hepatitis E is carried out in most medical institutions in Moscow; in accordance with existing orders of the Ministry of Health of the Russian Federation and the Department of Health: Moscow and consists of determining immunoglobulins? class G to the hepatitis E virus (anti-HGV IgG) in the blood serum of patients. Identification of this marker allows one to judge the presence of a current or past infection.
Disadvantages of methods; detection based on EEISA, in addition to low sensitivity (more than GO "12 M)j are also due to false detection; viral hepatitis E in patients - due to post-infectious immunity, cross-reactivity of antibodies, as well as insufficient sensitivity during the acute period) phases BFG . BI CONNECTIONS? WITH: THIS continues the active search for sensitive, specific, fast and easy-to-use methods for detecting hepatitis E markers.
Another group of methods for detecting viral hepatitis in serum: blood consists of registration; RNA BE using PCR; Determination of RNA. BFG methods; HSR cannot be used as a primary test for - confirmation or exclusion; diagnosis; But; May be; useful for confirming the diagnosis: Diagnosis1 of BFG is carried out by analyzing the 5 -non-coding region of RNA. However, assay results vary among different BFG genotypes.
Biological microchips have appeared on the Russian market, allowing for genotyping of BFG and determining an effective antiviral regimen; therapy. This biochip is an oligonucleotide chip for BFG genotyping based on analysis of the NS5B region. The results obtained indicate the ability of the biochip to identify all 6 genotypes and 36 subtypes of HCV, including the most virulent and drug-resistant forms.
On the one hand, PCR analysis methods are ultrasensitive and allow the detection and amplification of a signal from just one RNA molecule in a sample, but on the other hand, these methods are characterized by false positive results due to accidental contamination of samples, false negative results due to the high mutability of the virus and relatively high cost of analysis. Even in the same person, the level of HCV RNA can periodically change by more than millifold, leading to false negative results in the case of low? replication of the virus or if the virus persists in tissues without entering the blood. The results of quantitative determination of RIG and HCV in different laboratories do not agree well enough.
Of particular value for early detection of viral hepatitis C Bt biomaterial are HCV protein antigens due to the fact that they appear1 in blood serum several weeks earlier, even before the development of a full-fledged immune response of the body.
The surface antigen HCVcoreAg of the hepatitis C virus is the main marker of infection with the hepatitis C virus. It is detected 16 weeks before the appearance of antibodies in the blood due to the body’s immune response and before the development of clinical signs, while it is recorded in both acute and chronic phases diseases. There is only one foreign commercial product (Ortho Clinical Diagnostics) for ELISA diagnostics of hepatitis C during the acute phase, based on the detection of HCVcoreAg.
The structural protein HCVcoreAg, consisting of 121 amino acid residues, is located at the N-terminus of the polypeptide and is formed under the influence of cellular proteases. The first proteolytic hydrolysis occurs between residues 191 and 192 (site C1) and leads to the formation of glycoprotein E1. The second cutting site (C2) is located between amino acids 174 and 191. The corresponding cutting products are named p21 and p23. Analysis of expression in a number of mammalian cells showed that p21 is the main product, and p23 is found in minor quantities. It is possible that cleavage at sites C1 and C2 are interconnected processes, since p21 is formed under conditions when hydrolysis at G2 is not observed [G45]. HCVcoreAg is a core RNA-binding protein that appears to form the viral nucleocapsid. The biochemical properties of this protein are still poorly characterized. AFM studies of hepatitis C viral particles made it possible to obtain an image of the HCV capsid.
AFM chips
In the experimental part of the work, two types of AFM chips were used. Using the first type, MS identification of model proteins on the surface of AFM chips was carried out. These chips were substrates with functionally active chemical groups (hereinafter called AFM chips with a chemically activated surface), on which the molecules under study were caught and irreversibly immobilized through covalent bonds, the so-called “chemical phishing” procedure. The second type of AFM chips was used for MS identification of proteins on their surface, biospecifically captured from an analyte solution. Biological probes were previously immobilized on the surface of these chips in the working areas. Monoclonal antibodies against the marker proteins of viral hepatitis B and C (BFB and BFC) or aptamers against the gpl20 protein and thrombin were used as biological probes. For the biospecific-phishing procedure, chips with covalently immobilized probe molecules were incubated. in a% analyte solution containing only the detected protein, or blood serum samples
To perform the task of MS identification of model proteins covalently immobilized on the surface of AFM chips of the first type, the following were used in the work: avidin (Agilent, USA), HSA (Agilent, USA), P450 VMZ (kindly provided by Professor A.V. Munro, University of Manchester, UK), thrombin (Sigma, USA), a-FP and anti-a-FP (USBio, USA); To perform the task of MS identification of proteins on the surface of AFM chips of the second type, biospecifically captured from an analyte solution, monoclonal antibodies (MAbs) were used as probe molecules: anti-HCVcore (Virogen, USA), anti-HBVcore (Research Institute of Molecular Diagnostics, Moscow), anti-HBsAg (Aldevron, USA), as target molecules: HBVcoreAg, HCVcoreAg (Virogen, USA) and HBsAg (Aldevron, USA), gpl20 (Sigma, USA), troponin (USBio, USA).
In addition, the following substances were used in the work: acetonitrile, isopropanol, formic acid, distilled water (Merck, USA), trifluoroacetic acid (TFA), ammonium bicarbonate (Sigma, USA), α-cyano-4-hydroxycinnamic acid (HCCA), dihydroxybenzoic acid (DHB) (Bruker Daltonics, Germany), trypsin (Promega, USA).
Blood serum samples for AFM research were provided by the Department of Infectious Diseases in Children of the Russian State Medical University, the Central Research Institute of Epidemiology of Rospotrebnadzor, the Gabrichevsky Moscow Research Institute of Epidemiology: The presence of hepatitis C virus (HCV) particles in the blood serum samples was confirmed using the polymerase chain reaction (PCR) method using the "Amplisense HCV Monitor" test system (Central Research Institute of Epidemiology, Ministry of Health of the Russian Federation, Moscow).
AFM analysis was carried out in the Laboratory of Nanobiotechnology of the Institute of Biomedical Chemistry, Russian Academy of Medical Sciences. The counting of proteins and antigen/antibody complexes on the surface of the AFM chip was carried out based on the correlation of the heights of the corresponding images of proteins and their complexes measured using AFM, according to the method described in. ACM NTEGRA (NT-MDT, Russia) was used. AFM measurements were carried out in semi-contact mode. Cantilevers from the NT-MDT NSG10 series were used as probes. The typical radius of curvature of the needles was 10 nm, the resonant frequency ranged from 190 to 325 kHz. The scanning area of the chip was 400 μm2. Each measurement was carried out at least 3 times.
Immobilization of proteins and aptamers onto the surface of an AFM chip was carried out according to the following procedure.
To a protein solution (0.1 mM) with a volume of 2 μl, 8 μl of an NHS/EDC mixture solution (v/v=l/l) was added and mixed thoroughly. The resulting mixture was applied to the surface of the silanized chip and incubated for 2 minutes at room temperature. The chip was then washed twice in a thermal shaker with 1 ml of deionized water at 800 rpm and 37C. The quality of protein immobilization on the surface of the AFM chip was controlled by atomic force microscopy.
Immobilization of aptamers onto the chemically activated surface of an AEM chip was carried out as follows. To a stock solution of DSP with a concentration of 1.2 mM in DMSO/ethanol (v/v=l/l)4, a solution of PBS buffer 50 mM (pH 7.4) was also added in a ratio of 1/1 by volume. The working solution thus obtained was applied to the surface of the AFM chip and incubated for 10 minutes. After that, washing was carried out with a 50% ethanol solution in water with a volume of 1 ml at 15 C for 10 minutes. An aptamer solution with a concentration of 3 JIM was applied to the activated zone of the AFM chip and incubated for 4 minutes while stirring at a speed of 800 rpm. Blocking of unreacted amino groups of the DSP cross-linker was carried out in the presence of a 5 mM Tris-HCl solution for 10 minutes at 37C. The final stage of washing was carried out twice with an aqueous solution of 1 ml for 10 minutes at 25C.
A trypsinolytic mixture containing a buffer solution of 150 mM NH4HCO3, acetonitrile, 0.5 M guanidine hydrochloride, and glycerol (pH 7.4) was applied to the surface of an AFM chip with immobilized probe molecules. Then 0.5 μl of a solution of modified porcine trypsin with a concentration of 0.1 μM was added to the buffer solution. The AFM chip was incubated in a humid environment for 2 hours at a constant temperature of 45C, 0.5 μl of trypsin solution (0.1 μM) was again added to its surface, and incubation continued for another 12 hours. The trypsinolytic mixture was washed off from the surface of the AFM chip with a 10 μL elution solution containing 70% acetonitrile in 0.7% trifluoroacetic acid (TFA). The hydrolyzate thus obtained from the surface of the AFM chip was dried in a vacuum evaporator at 45C and 4200 rpm. Next, the peptide mixture was dissolved in 10 μl of a 5% formic acid solution or in 10 μl of a 0.7% TFA solution for subsequent MS analysis.
When performing MS analysis with MALDI ionization type, samples were prepared as follows. Samples dissolved in 0.7% TFA solution in a volume of 10 μl were concentrated and desalted using ZipTip C18 microtips (Millipore, USA) in accordance with the manufacturer's protocol and mixed with a saturated solution of matrix containing HCCA or DHB in 50% acetonitrile with 0 .7% TFA. The resulting mixture was applied to an MTP-size MALDI target.
- identification of proteins caught using “chemical phishing” on the surface of an AFM chip from an analyte solution
At this stage of the experimental work, MS spectra were obtained for model proteins chemically immobilized on the surface of AFM chips from an analyte solution. The concentration range of the studied proteins in the analyte solution for avidin, HSA, anti-aFP was 10"-10"9 M, troponin, aFP and P450 VMZ - 10"6-10"8 M.
MS analysis was carried out for 6 types of proteins, different in their origin, molecular weight, number of trypsinolysis sites and their spatial accessibility, degree of hydrophobicity of the amino acid sequence (ratio of hydrophobic to hydrophilic amino acids), which were covalently immobilized on the surface of the AFM chip from an analyte solution ( Table 1). In these experiments, AFM chips were used, which contained working and control zones. The working zone was a chemically activated area of the AFM chip surface, on which “chemical phishing” of model proteins occurred; the control zone was a chemically inactive area of the chip surface. Counts of visualized captured molecules were recorded using AFM. The experimental data of AFM analysis obtained for the above-mentioned model proteins, namely the number of molecules caught on the surface of the working area of the AFM chip, are presented in Table 2. The column “concentration of protein molecules in solution” of Table 2 shows data for the minimum recorded concentration of the corresponding protein in analyte solution.
As can be seen from Table 2, the number of molecules registered in the working area of the AFM chip for all proteins presented was -1040 molecules. The sensitivity limit of MS detectors is about 105 molecules. Thus, for the presented model proteins, successful irreversible immobilization was carried out on the surface of the AFM chip, and the number of AFM-registered protein objects was sufficient for subsequent MS identification. At the same time, the minimum recorded concentration of model proteins in the incubation solution was quite low, 10" -10" M.
Mass spectrometric analysis of the samples was carried out using MALDI and ESI ionization types. AFM chip after incubation in the appropriate avidin solution with a concentration of 10"9 M. Analysis of these spectra made it possible to reliably identify avidin (Gallus Gallus) by its two proteotypic peptides: SSVNDIGDDWK (m/z=618.6) and VGINIFTR (m/z= 460.4). Both peptides had well-defined peaks of their doubly charged ions (MS spectra). Using AFM-MS analysis of the chemically activated working area of the AFM chip after incubation in a solution of the analyte protein with a concentration of 10"8 M, another small protein was identified - troponin I. The MS and MS/MS spectra corresponding to the peptide doubly charged ion 1449 Da are presented in Figure 3. MS analysis of the experimentally obtained spectra made it possible to reliably detect and identify human troponin (gi 2460249) on the surface of the AFM chip with a probability of more than 95%. .
Figure 5 shows tandem fragmentation spectra of a globular protein - human serum albumin (HSA), which performs transport functions in blood plasma. The spectra were obtained from the chemically activated working area of the AFM chip after incubation in the appropriate albumin solution with a concentration of 10"9 M. Analysis of these spectra made it possible to reliably identify human albumin by its two proteotypic peptides: VPQVSTPTLVEVSR (m/z = 756.5) and YLYEIAR (m/z=464.3). Both peptides had well-defined peaks of their doubly charged ions (MS spectra).
MS/MS spectra of trypsinized objects from the chemically activated surface of an AFM chip incubated in a solution of human serum albumin (C = 10 9 M). Peptide VPQVSTPTLVEVSR with m/z=756.5 (A), peptide YLYEIAR with m/z=464.3 (B). Experimental conditions: measurements were carried out on an LC/MSD Trap XCT Ultra mass spectrometer (Agilent).
Thus, MS analysis allowed the identification of proteins detected by AFM. Based on the data obtained, a relationship was identified between the number of identified proteotypic peptides on the surface of the AFM chip and the content of the desired protein in the analyte solution. This dependence, for example, for the proteins P450 BMZ and HSA, covalently immobilized on the chemically activated surface of an AFM chip, is shown in Figure 6. As can be seen in Figure 6, the higher the protein concentration in the analyte solution (-KG6 M), the greater the number of peptides can be reliably identified both in the case of MALDI-MS and ESI-MS analysis. There were no significant differences between the number of identified peptides in the concentration range 10"6-10"9 M among the analyzed proteins in the analyte solution.
Dependence of the number of identified peptides of analyte molecules on the protein concentration in the incubation solution. (A) - analysis of a mixture of peptides of model proteins HSA, VMS on mass spectrometers with MALDI-type ionization Bruker Microflex (Bruker Daltonics, Germany) and Autoflex III (Bruker Daltonics, Germany); (B) - analysis of a mixture of peptides of model proteins HSA, VMS on a mass spectrometer with ESI-type ionization LC/MSD Trap XST Ultra (Agilent, USA).
The results obtained allowed us to conclude that AFM-MS (MALDI and ESI) makes it possible to detect and identify protein molecules, different in their physicochemical properties, covalently captured from an analyte solution on the surface of an AFM chip.
At the same time, in the control zone of the AFM chip (non-activated) after its incubation in the analyte solution, the AFM method did not detect the presence of objects on the surface of the chip corresponding in height to protein molecules. MS analysis also did not reveal objects of a protein nature. Thus, it was experimentally proven that AFM adequately registers the desired objects - protein molecules of the analyte.
The next stage of this work was the development of an AFM-MS combination scheme for identifying proteins caught from solution. account of biospecific interactions.
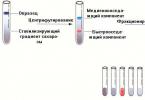
The scheme for carrying out mass spectrometric analysis in the case of biospecific AFM fishing of proteins from solution is presented in Figure 7. According to the given scheme, probe molecules were first immobilized on the surface of the working area of AFM chips, which were monoclonal1 antibodies against protein markers of viral hepatitis B and C or aptamers against the HIV-1 glycoprotein gpl20 and thrombin, while the surface of the control zone did not contain immobilized probe molecules. Quality control of immobilization of probe molecules was carried out by AGM visualization. Then such a chip was incubated in an analyte solution containing the protein under study. After the stage of washing from nonspecifically adsorbed molecules on the surface of the chip, and the stage of preparing the sample for subsequent mass spectrometric analysis, MS analysis of AFM-recorded proteins was carried out on the surface of the AFM chip.
The experimental part of this section involved two stages of analysis. At the first stage, it was necessary to carry out MS identification of protein probe molecules covalently immobilized on the AFM chip; at the second stage, target proteins caught on the corresponding partner molecules from solution or from blood serum samples due to biospecific interactions. For this purpose, MS analysis of mAbs against HCV and HBV marker proteins, anti-HCVcore and anti-HBVcore, covalently immobilized on the surface of AFM chips was carried out. For MAbs against anti-HCVcore and anti-HBVcore proteins, tandem fragmentation spectra and peptide map spectra were obtained for the first time in this work.
2 LITERATURE REVIEW.
2.1 Mass spectrometry in proteomics.
2.1.1 General principles.
2.1.2 Proteomic analysis using mass spectrometry.
2.1.3 Identification of proteins using the peptide mass fingerprint method.
2.1.4 Identification of proteins using the peptide fragmentation fingerprint method.
2.2 Interpretation of the results of mass spectrometric identification of proteins.
2.2.1 Determination of the list of identified proteins.
2.2.2 Identification of highly homologous proteins.
2.2.3 Databases of amino acid sequences of proteins.
2.3 Mass spectrometric analysis of single gene products.
2.3.1 Proteotyping and population proteomics.
2.3.2 Identification of protein microheterogeneity using the “top-down” method.
2.3.3 Identification of genetically determined protein polymorphism using the “bottom-up” method.
2.3.4 Databases of protein and gene polymorphisms.
2.3.5 Mass spectrometry data repositories.
3 MATERIALS AND METHODS.
3.1 Materials.
3.1.1 Mass spectrometric data for proteins of the microsomal fraction of human liver.
3.1.2 Control set of mass spectra “Aurum Dataset”.
3.1.3 Mass spectrometric data from the PRIDE proteomic repository.
3.1.4 Databases of amino acid sequences of human proteins.
3.1.5 Data on possible polymorphisms of human proteins.
3.2 Methods.
3.2.1 Web server for identification of proteins by mass spectra.
3.2.2 Batch processing of mass spectra using the peptide mass fingerprint method.
3.2.3 Batch processing of tandem mass spectra.
3.2.4 One-dimensional proteomic mapping.
3.2.5 Software implementation of an iterative algorithm for identifying PDAs.
3.2.6 Validation of the OAP identification algorithm.
4 RESULTS AND DISCUSSION.
4.1 Increasing the degree of coverage of amino acid sequences by identified peptides.
4.1.1 Identification of proteins in gel sections.
4.1.2 One-dimensional proteomic maps and their properties.
4.1.3 Identification of highly homologous proteins of the cytochrome P450 superfamily by increasing the degree of coverage of amino acid sequences by identified peptides.
4.2 Identification of PDAs in proteins of the cytochrome P450 superfamily.
4.3 Algorithm for identification of PDA.
4.3.1 Iterative scheme for processing tandem mass spectra.
4.3.2 Sensitivity and specificity of the PDA identification algorithm.
4.4 Application of an iterative algorithm to identify PDAs in mass spectrometric data from the PRIDE proteomic repository.
4.4.1 Initial data used to identify PDA.
4.4.2 Identification of peptides and proteins using mass spectrometry data downloaded from the PRIDE repository.
4.4.3 Identification of single amino acid polymorphisms.
4.5 Analysis of identified PDAs.
4.5.1 Analysis of OAP-containing peptides.
4.5.2 Relationship of identified PDAs with human diseases.
Recommended list of dissertations
Post-translational regulation of cytochromes P450 subfamily 2B 2013, Doctor of Biological Sciences Zgoda, Viktor Gavrilovich
Mass spectrometric determination of the activity and content of cytochromes P450 2013, Candidate of Biological Sciences Moskaleva, Natalya Evgenievna
Structural and functional mapping of proteins of cytochrome P450-containing monooxygenase systems 2002, Doctor of Biological Sciences Kolesanova, Ekaterina Fedorovna
Method for recognizing amino acid sequences in peptide mass spectra for proteomics problems 2007, candidate of technical sciences Lyutvinsky, Yaroslav Igorevich
Universal scale of chromatographic retention times of biomacromolecules in problems of “rapid-fire” proteomics 2011, Candidate of Physical and Mathematical Sciences Pridatchenko, Marina Leonidovna
Introduction of the dissertation (part of the abstract) on the topic “Analysis of mass spectra of peptide fragments for the identification of genetically determined polymorphism of proteins”
The Ensembl database contains information on 20,469 coding genes, derived from the human genome assembly performed at the US National Center for Biotechnology Information (February 2009). The small number of genes allows us to conclude that the complexity of living systems is achieved at the level of regulation of transcription, translation, and post-translational modifications. Alternative splicing and modifications such as phosphorylation, glycosylation, along with proteolytic processing, lead to the formation of a variety of proteins, the number of which exceeds the number of genes by several orders of magnitude. Estimates carried out by various methods show that the human proteome can consist of several million proteins differing in their chemical structure.
The traditional approach to proteome research is based on the use of immunohistochemical staining of tissue sections. The first version of the human proteomic atlas was built using antibodies. The use of biological microarrays containing antibodies coated on them makes it possible to identify and quantify up to several hundred proteins in a single sample. However, this approach has limitations that are associated with the need to develop and verify antibodies, insufficient specificity due to cross-interactions, and the relatively low affinity of antigen-antibody complexes. In this regard, a more universal method of protein identification, biological mass spectrometry, which does not require immunospecific reagents, has acquired particular importance for proteome research.
In mass spectrometric analysis of biomaterial, identification of protein molecules is carried out by comparing the measured mass-charge characteristics of proteins and/or their proteolytic fragments with theoretical values calculated on the basis of amino acid sequences encoded in the genome. It must be taken into account that the genome sequence does not explicitly contain information about alternative splicing sites and possible post-translational modifications. Identification of cases of alternative splicing is possible on the basis of experimental data: the source of information about splice isoforms is DNA coding databases. Identification of post-translational modifications is carried out using high-precision mass spectrometry of proteins or using tandem mass spectrometry of peptide fragments
Along with alternative splicing and post-translational modification, the diversity of protein molecules increases due to the translation of non-synonymous Single Nucleotide Polymorphism (nsSNP). Establishing the presence of nsSNP is done using genotyping, while confirming the presence of a corresponding residue substitution in the primary structure of the protein, that is, identifying single amino acid polymorphisms (SAP, Single Amino Acid Polymorphism, SAP), is a proteotyping task.
The importance of identifying and studying alternative splicing, PDA, and post-translational modifications at the protein level is due to the influence of these processes on the expression level and functional properties of proteins. It is known that changes in the activity or expression level of proteins can lead to the emergence and development of socially significant diseases, including cancer, cardiovascular and neurodegenerative diseases.
The presence of about 65 thousand nonsynonymous polymorphisms, presumably translated into PDA, has been established in the genome, with more than 30% presumably leading to changes in the functional properties of proteins. Since changes in protein activity are associated with the development of diseases, studies of PDA are necessary to determine the structural reasons underlying the observed functional disorders. The tasks of proteotyping include qualitative and quantitative determination of the expression of allelic variants of genes at the proteomic level, as well as monitoring the frequency of occurrence of expressed allelic variants of proteins at the population level.
Identification of PDAs in high-throughput mode using mass spectrometry is associated with technical limitations. For the task of proteotyping, the most adequate approach is the “top-down” approach, that is, mass spectrometry of intact proteins (and not their fragments). However, the sensitivity of this approach is low, at the level of 10 h-10 5 M. As a result, the identification of tens, less often hundreds, and, only in exceptional cases, up to a thousand proteins is ensured. Most often, another approach is used in biological mass spectrometry - “bottom-up”, in which the presence of a protein in a sample is established by identifying its proteolytic fragments (peptides). In most cases, to identify a protein, a small number of peptides are sufficient, which together can constitute no more than 5% of the biopolymer sequence. For the remaining part of the amino acid sequence of the protein, it is impossible to determine the presence/absence of chemical modifications of amino acid residues or amino acid polymorphisms.
To identify single amino acid polymorphisms of human proteins using biological mass spectrometry, it is necessary to increase the degree of protein amino acid sequence coverage by identifying additional proteolytic peptides of the protein. This is possible by performing an experiment with a large number of partially or fully replicated mass spectrometry analyses. In addition, data from proteomics experiments performed by multiple research groups can be combined into a single study. Access to an extensive collection of mass spectra is provided by various proteomic repositories, the most popular of which, PRIDE (Protein Identification Database), stores the results of more than 13 thousand proteomic experiments. The higher the degree of coverage of the amino acid sequence of a protein by identified peptides, the greater the likelihood of confirming the presence or absence of single amino acid substitutions in the protein structure.
Given the availability of a vast amount of mass spectrometric data, solving the problem of proteotyping is possible through the use of computational methods of bioinformatics. For example, analysis of mass spectrometry data can be carried out using expressed fragment databases (ESTs), which contain information about translated variants of nonsynonymous gene polymorphisms. The second method, implemented in many protein identification programs, is a comparison of mass spectra with a database of theoretical protein sequences, allowing for inaccuracies in the form of substitutions of amino acid residues.
The disadvantages of the above approaches are well known. Expressed fragment databases contain redundant information, including sequencing errors, which complicates the analysis of mass spectrometry results. When analyzing a sample in which several hundred proteins have been identified, the resulting mass spectra must be compared with hundreds of thousands of transcripts accumulated over decades, which contain more than 5% errors. When analyzing mass spectra with the assumption of possible inaccuracies in the database, information about actually existing non-synonymous substitutions that were established by genotyping is ignored. Artificial assumptions introduced into the database or protein identification algorithm reduce the reliability of the results. These shortcomings of existing proteotyping methods necessitate the improvement of computational approaches to PDA identification.
The goal of the work was to develop a method for analyzing mass spectrometric data to identify single amino acid polymorphisms resulting from the translation of nonsynonymous nucleotide substitutions in the corresponding genes, and to use the developed method to identify amino acid substitutions in human proteins. To achieve the goal, the following tasks were solved:
1. Process the mass spectra of peptide fragments to increase the degree of coverage of amino acid sequences of proteins by identified peptides.
2. Using a model set of mass spectrometric data that provides a high degree of sequence coverage, develop a method for identifying single-amino acid substitutions in human proteins.
3. Summarize the method for identifying single-amino acid substitutions in the form of a universal algorithm for processing tandem mass spectra; evaluate the sensitivity and specificity of the created algorithm.
4. Apply the created algorithm to process a repository of mass spectrometric data, identify single-amino acid polymorphisms and characterize human proteins containing the identified polymorphisms.
2 LITERATURE REVIEW
The term “proteome” - the complete set of proteins expressed in the body - was first proposed by Mark Wilkins in connection with the emerging need to supplement knowledge about genomes with relevant information about the proteins encoded in them. The object of study when analyzing the proteome can be either a whole organism or a cellular component, tissue, subcellular structure, for example, the nucleus, microsomal fraction, etc.
The results of a large-scale inventory of proteins using mass spectrometry were published in the work of Shevchenko et al in 1996. The advent of biological mass spectrometry marked the advent of the era of high-throughput post-genomic technologies, which make it possible to obtain information about genes and proteins on the scale of the entire organism as a result of a single experiment. Postgenomic technologies, in addition to proteomics, also include genomics and transcriptomics. When analyzing genetic material, postgenomic technologies make it possible to determine the presence of gene polymorphism using whole-genome re-sequencing or high-density mapping of single nucleotide substitutions (SNPs).
Existing approaches to studying protein diversity can be divided into two directions. In the first case, before setting up the experiment, it is predetermined which protein molecules are planned to be identified. In this approach, protein identification is carried out using antibodies, which are used for histochemical staining of tissue sections followed by obtaining micrographs of cells. In a microphotograph of a section, fluorescent areas correspond to the localization sites of the detected antigen protein, and the intensity of fluorescence allows one to obtain a quantitative assessment of the content of this protein.
As part of the large international project ProteinAtlas, large-scale production of antibodies to proteins of all human genes is being carried out. This project produced and made available for public use more than 400,000 micrographs of immunohistochemically stained sections for virtually all human tissues. A comparative analysis of the distribution of specific protein staining made it possible, in particular, to identify characteristic protein expression profiles for cancer tissues. However, staining tissue sections using fluorescently labeled antibodies is a rather crude method for studying the proteome. Firstly, as the developers of the ProteinAtlas project themselves point out, the quality of many commercially available antibodies is extremely low. When verified, approximately half of the purchased antibodies show low specificity for the antigen under study, and antibody preparations are often characterized by low purity. Secondly, a large number of antigen-antibody complexes are characterized by a dissociation constant (107-108 M), which limits the sensitivity when measuring protein concentrations.
In addition to histochemical analysis, proteome research is carried out using biological microarrays. Protein microarrays are a powerful tool for translational medicine, but are limited in their ability to be used for large-scale proteome research. The use of microarray technologies in proteomics rarely makes it possible to identify more than ten proteins at a time: with an increase in the number of analyzed proteins, standardization of the conditions for antigen-antibody interaction is difficult. Thus, the use of microchips leads to false-negative results in the case when the differences in dissociation constants for antigen-antibody complexes are several orders of magnitude. In addition, the stability of antibodies very much depends on their storage conditions, so the use of protein microarrays is limited to the time immediately after their manufacture, which does not allow this type of analysis to become widespread.
The second direction of proteome research is associated with setting up an experiment in the so-called “panoramic” (survey) mode, when it is not known in advance which proteins can be identified. Potentially, as a result of a panoramic experiment, any proteins encoded in the genome of the organism under study can be identified, including even products from regions of the genome considered to be non-coding. Technical and methodological tools for genome-wide proteome research are provided by biological mass spectrometry.
Similar dissertations in the specialty "Mathematical biology, bioinformatics", 01/03/09 code VAK
Transcriptomic-proteomic approach for the analysis of proteoforms of the HepG2 cell line 2018, Candidate of Biological Sciences Kiseleva, Olga Igorevna
Transcriptome and proteome of chromosome 18: extrapolation of analysis results to human genomes and model objects 2017, Doctor of Biological Sciences Ponomarenko, Elena Aleksandrovna
Assessment of the plasticity of the blood plasma proteome of a healthy person under extreme living conditions 2011, Candidate of Biological Sciences Trifonova, Oksana Petrovna
Search and identification of potential biomarkers of ovarian cancer in human serum 2015, Candidate of Biological Sciences Arapidi, Georgy Pavlovich
Analysis of photodynamics of protein complexes of thylakoid membranes using high-resolution mass spectrometry 2011, Candidate of Chemical Sciences Galetsky, Dmitry Nikolaevich
Conclusion of the dissertation on the topic “Mathematical biology, bioinformatics”, Chernobrovkin, Alexey Leonidovich
1. Proteomic mapping of mass spectrometric data was carried out, including identification of proteins using the peptide mass fingerprint method, followed by analysis aimed at identifying protein-specific proteotypic peptides. Using the example of proteins of the cytochrome P450 superfamily, it was shown that by mapping protein localization zones in the gel, the degree of sequence coverage by identified peptide fragments increases by 27%.
2. Proteolytic peptides specific for the forms of cytochromes P450 CYP3A4 and CYP3A5 have been identified, the sequence identity of which is 82%. Allelic variants of translation of cytochromes CYP3A4 and CYP3A5 were identified, containing single-amino acid polymorphisms M445N (ZA4), K96E (ZA4), L82R (ZA5) and D277E (ZA5).
3. An iterative algorithm has been developed to identify single-amino acid polymorphisms of proteins using tandem mass spectra of proteolytic peptides. When tested on the Aurum Dataset control set, the polymorphism detection algorithm showed a specificity of more than 95%. The sensitivity of the algorithm was 30%, which corresponds to the average coverage of the sequences included in the control set.
4. As a result of the analysis of mass spectrometric experiments deposited in the PRIDE repository, a total of 270 single-amino acid polymorphisms in 156 human proteins were identified, including 51 PDAs (45 proteins) associated with diseases, including disorders of the blood coagulation system and systemic amyloidosis.
List of references for dissertation research Candidate of Biological Sciences Chernobrovkin, Alexey Leonidovich, 2012
1. Archakov A.I. and others. A method for increasing the accuracy of determining the sequence of amino acid residues of a biopolymer based on mass spectrometric analysis data, computer system //2010.
2. Archakov A.I. et al. Cytochromes P450, drug disease and personalized medicine. Part 1 // Clinical medicine. 2008. T. 86. No. 2. P. 4-8.
3. Klyuev N.A., Brodsky E.S. Modern methods of mass spectrometric analysis of organic compounds // Ros. chem. and. (J. Russian Chemical Society named after D.I. Mendeleev). 2002. T. XLVI. No. 4. pp. 57-63.
4. Fox A.B. et al. One-dimensional proteomic mapping of human liver cytochromes P450 // Biochemistry. 2009. T. 74. No. 2. P. 153-161.
5. Myasoedova K.N. New in the study of cytochromes P450 // Biochemistry. 2008. T. 73. No. 9. pp. 1199-1205.
6. Petushkova N.A. et al. Identification of cytochromes P450 of microsomes of human liver cells using mass spectrometry // Biomedical chemistry. 2007. T. 53. No. 4. pp. 400-11.
7. Ponomarenko E.A., Ilgisonis E.V., Lisitsa A.B. Technologies of knowledge in proteomics // Bioorganic chemistry. 2011. T. 37. No. 2. P. 190-198.
8. Ponomarenko E.A. et al. Identification of differentially expressed proteins using automatic meta-analysis of proteomic publications // Biomedical chemistry. 2009. T. 3. No. 1. P. 10-16.
9. Savelyeva M. et al. The significance of genetic polymorphism of cytochrome P450 isoenzymes for personalized selection and dosing regimens of antidepressants and antipsychotics // Clinical Medicine. 2008. T. 86. No. 11. P. 22-28.
10. A gene-centric human proteome project: HUPO~the Human Proteome organization. // Molecular & cellular proteomics: MCP. 2010. T. 9. No. 2. P. 4279.
11. Aebersold R., Mann M. Mass spectrometry-based proteomics. //Nature. 2003. T. 422. No. 6928. P. 198-207.
12. Ahrne E., Mtiller M., Lisacek F. Unrestricted identification of modified proteins using MS/MS // Proteomics. 2010. T. 10. No. 4. P. 671-686.
13. Akiyama M. h «p. Ichthyosis bullosa of Siemens: its correct diagnosis facilitated by molecular genetic testing. // The British journal of dermatology. 2005. T. 152. No. 6. C. 1353-6.
14. Alves G. h jxp. Calibrating E-values for MS2 database search methods. // Biology direct. 2007. T. 2. No. 1. P. 26.
15. Alves G., Ogurtsov A.Y., Yu Y.-K. RAId DbS: mass-spectrometry based peptide identification web server with knowledge integration. // BMC genomics. 2008. T. 9. P. 505.
16. Archakov A. h zip. Biospecific irreversible fishing coupled with atomic force microscopy for detection of extremely low-abundant proteins. // Proteomics. 2009. T. 9. No. 5. P. 1326-43.
17. Archakov A. h ap. Gene-centric view on the human proteome project: the example of the Russian roadmap for chromosome 18. // Proteomics. 2011. T. 11. No. 10. P. 1853-6.
18. Archakov A.I. h zip. AFM fishing nanotechnology is the way to reverse the Avogadro number in proteomics. // Proteomics. 2007. T. 7. No. 1. P. 4-9.
19. Archakov A.I., Bachmanova G.I. Cytochrome P-450 and active oxygen. London: Taylor & Francis, 1990.
20. Asara J.M. h ^p. A label-free quantification method by MS/MS TIC compared to SILAC and spectral counting in a proteomics screen. // Proteomics. 2008. T. 8. No. 5. P. 994-9.
21. Bairoch A., Apweiler R. The SWISS-PROT protein sequence database and its supplement TrEMBL in 2000. // Nucleic acids research. 2000. T. 28. No. 1. P. 45-8.
22. Baldwin M. a. Protein identification by mass spectrometry: issues to be considered. //Molecular & cellular proteomics: MCP. 2004. T. 3. No. 1. P. 1-9.
23. Bantscheff M. h ap. Quantitative chemical proteomics reveals mechanisms of action of clinical ABL kinase inhibitors. // Nature biotechnology. 2007a. T. 25. No. 9. P. 1035-44.
24. Bantscheff M. h,qp. Quantitative mass spectrometry in proteomics: a critical review. //Analytical and bioanalytical chemistry. 2007b. T. 389. No. 4. P. 1017-31.
25. Barsnes H. h ap. PRIDE Converter: making proteomics data-sharing easy. // Nature biotechnology. 2009. T. 27. No. 7. P. 598-9.
26. Baumgardner L.A. h Fast parallel tandem mass spectral library searching using GPU hardware acceleration. // Journal of proteome research. 2011. T. 10. No. 6. P. 2882-8.
27. Beck F. h ap. The good, the bad, the ugly: Validating the mass spectrometric analysis of modified peptides // PROTEOMICS. 2011. C. n/a-n/a.
28. Bell A.W. h/jp. The protein microscope: incorporating mass spectrometry into cell biology. //Nature methods. 2007. T. 4. No. 10. P. 783-4.
29. Binz P.-A. h ,qp. A Molecular Scanner To Automate Proteomic Research and To Display Proteome Images // Analytical Chemistry. 1999. T. 71. No. 21. P. 49814988.
30. Binz P.-A. h pp. The molecular scanner: concept and developments. // Current opinion in biotechnology. 2004. T. 15. No. 1. pp. 17-23.
31. Birney E. h ap. An overview of Ensembl. // Genome research. 2004. T. 14. No. 5. P. 925-8.
32. Birney E., Clamp M., Hubbard T. Databases and tools for browsing genomes. // Annual review of genomics and human genetics. 2002. T. 3. P. 293-310.
33. Bochet P. h flp. Fragmentation-free LC-MS can identify hundreds of proteins // PROTEOMICS. 2010. T. 11. No. 1. C. n/a-n/a.
34. Boguski M.S., Lowe T.M., Tolstoshev C.M. dbEST-database for "expressed sequence tags". //Nature genetics. 1993. T. 4. No. 4. P. 332-3.
35. Borges C.R. hnp. Full-length characterization of proteins in human populations. // Clinical chemistry. 2010. T. 56. No. 2. P. 202-11.
36. Bromberg Y., Rost B. SNAP: predict effect of non-synonymous polymorphisms on function. //Nucleic acids research. 2007. T. 35. No. 11. P. 3823-35.
37. Brosch M. h np. Comparison of Mascot and XITandem performance for low and high accuracy mass spectrometry and the development of an adjusted Mascot threshold. // Molecular & cellular proteomics: MCP. 2008. T. 7. No. 5. P. 962-70.
38. Bunger M.K. h ^p. Detection and validation of non-synonymous coding SNPs from orthogonal analysis of shotgun proteomics data. // Journal of proteome research. 2007. T. 6. No. 6. P. 2331-40.
39. Bunkenborg J. h jip. Screening for N-glycosylated proteins by liquid chromatography mass spectrometry. // Proteomics. 2004. T. 4. No. 2. P. 454-65.
40. Butenas S., Mann K.G., Butenas B. Blood Coagulation. : MAIK Nauka/Interperiodica distributed exclusively by Springer Science+Business Media LLC., 2002.
41. Canas B. h jyp. Mass spectrometry technologies for proteomics. // Briefings in functional genomics & proteomics. 2006. T. 4. No. 4. P. 295-320.
42. Care M.A. h Deleterious SNP prediction: be mindful of your training data! // Bioinformatics (Oxford, England). 2007. T. 23. No. 6. P. 664-72.
43. Casado-Vela J. h flp. Lights and shadows of proteomic technologies for the study of protein species including isoforms, splicing variants and protein post-translational modifications. // Proteomics. 2011. T. 11. No. 4. pp. 590-603.
44. Chapman P.F. hap. Genes, models and Alzheimer's disease // Trends in Genetics. 2001. T. 17. No. 5. P. 254-261.
45. Chen M. h ap. Annotation of Non-Synonymous Single Polymorphisms in Human Liver Proteome by Mass Spectrometry // Protein and Peptide Letters. 2010. T. 17. No. 3. pp. 277-286.
46. Chen R. h zip. Glycoproteomics analysis of human liver tissue by combination of multiple enzyme digestion and hydrazide chemistry. // Journal of proteome research. 2009. T. 8. No. 2. P. 651-61.
47. Choudhary J.S. h Interrogating the human genome using uninterpreted mass spectrometry data. // Proteomics. 2001a. T. 1. No. 5. P. 651-67.
48. Choudhary J.S. h "p. Matching peptide mass spectra to EST and genomic DNA databases. // Trends in biotechnology. 2001b. T. 19. No. 10 Suppl. C. S17-22.
49. Choudhury V. h ap. Two novel antithrombin variants (L99V and Q118P) which alter the heparin binding // Nouvelle Revue Française. 1994. T. 36. P. 268.
50. Colinge J., Bennett K.L. Introduction to computational proteomics. // PLoS computational biology. 2007. T. 3. No. 7. C. el 14.
51. Cooksey A.M. hap. Identifying blood biomarkers and physiological processes that distinguish humans with superior performance under psychological stress. //PloS one. 2009. T. 4. No. 12. P. e8371.
52. Cooper D. The human gene mutation database // Nucleic Acids Research. 1998. T. 26. No. l.C. 285-287.
53. Côté R.G. h up. The Ontology Lookup Service: more data and better tools for controlled vocabulary queries. // Nucleic acids research. 2008. T. 36. No. Web Server issue. C.W372-6.
54. Cottrell J.S. Protein identification by peptide mass fingerprinting. // Peptide research. 1994. T. 7. No. 3. P. 115-24.
55. Craig R., Beavis R.C. TANDEM: matching proteins with tandem mass spectra. // Bioinformatics (Oxford, England). 2004. T. 20. No. 9. P. 1466-7.
56. Craig R., Cortens J.P., Beavis R.C. Open source system for analyzing, validating, and storing protein identification data. // Journal of proteome research. 2004. T. 3. No. 6. P. 1234-42.
57. Creasy D.M., Cottrell J.S. Error tolerant searching of uninterpreted tandem mass spectrometry data // PROTEOMICS. 2002. T. 2. No. 10. P. 1426-1434.
58. Crockett D.K. hap. Annotated proteome of a human T-cell lymphoma. // Journal of biomolecular techniques: JBT. 2005. T. 16. No. 4. P. 341-6.
59. Dai D. h jvp. Identification of Variants of CYP3A4 and Characterization of Their Abilities to Metabolize Testosterone and Chlorpyrifos // J. Pharmacol. Exp. Ther. 2001. T. 299. No. 3. P. 825-831.
60. Delahunty C., Yates J.R. Identification of proteins in complex mixtures using liquid chromatography and mass spectrometry. // Current protocols in cell biology / editorial board, Juan S. Bonifacino. et al.. 2003. T. Chapter 5. C. Unit 5.6.
61. Delahunty C.M., Iii J.R.Y. Tech Insight MudPIT: multidimensional protein identification technology Tech Insight // Biotechniques. 2007. T. 43. No. 5.
62. Desiere F. h jjp. The PeptideAtlas project. // Nucleic acids research. 2006. T. 34. No. Database issue. C. D655-8.
63. Deutsch E. mzML: a single, unifying data format for mass spectrometer output. // Proteomics. 2008. T. 8. No. 14. P. 2776-7.
64. Deutsch E.W. The PeptideAtlas Project. // Methods in molecular biology (Clifton, N.J.). 2010. T. 604. pp. 285-96.
65. Deutsch E.W. h ^p. A guided tour of the Trans-Proteomic Pipeline. // Proteomics. 2010. T. 10. No. 6. C. 1150-9.
66. Deutsch E.W. h ^p. Human Plasma PeptideAtlas. // Proteomics. 2005. T. 5. No. 13. P. 3497-500.
67. Deutsch E.W., Lam H., Aebersold R. PeptideAtlas: a resource for target selection for emerging targeted proteomics workflows. // EMBO reports. 2008. T. 9. No. 5. P. 429-34.
68. Eckel-Passow J.E. hjsp. An insight into high-resolution mass-spectrometry data. // Biostatistics (Oxford, England). 2009. T. 10. No. 3. P. 481-500.
69. Eng J.K., McCormack A.L., Yates III J.R. An approach to correlate tandem mass spectral data of peptides with amino acid sequences in a protein database // Journal of the American Society for Mass Spectrometry. 1994. T. 5. No. 11. P. 976-989.
70. Eriksson J., Fenyo D. Probity: A Protein Identification Algorithm with Accurate Assignment of the Statistical Significance of the Results // Journal of Proteome Research. 2004. T. 3. No. 1. P. 32-36.
71. Falkner J. a h up. Validated MALDI-TOF/TOF mass spectra for protein standards. // Journal of the American Society for Mass Spectrometry. 2007. T. 18. No. 5. P. 850-5.
72. Farrah T. h A high-confidence human plasma proteome reference set with estimated concentrations in PeptideAtlas. // Molecular & cellular proteomics: MCP. 2011.
73. Field D., Wilson G., Gast C. van der. How do we compare hundreds of bacterial genomes? // Current opinion in microbiology. 2006. T. 9. No. 5. P. 499-504.
74. Frazer K. a h ap. A second generation human haplotype map of over 3.1 million SNPs. //Nature. 2007. T. 449. No. 7164. P. 851-61.
75. Fredman D. h ap. HGVbase: a curated resource describing human DNA variation and phenotype relationships. // Nucleic acids research. 2004. T. 32. No. Database issue. C.D516-9.
76. Freed G.L. h ^p. Differential capture of serum proteins for expression profiling and biomarker discovery in pre- and posttreatment head and neck cancer samples. // The Laryngoscope. 2008. T. 118. No. 1. P. 61-8.
77. Gabellini N. NTRK2 (Neurotrophic tyrosine kinase, receptor, type 2) // Atlas Genet Cytogenet Oncol Haematol. 2008. T. 12. No. 4. P. 314-317.
78. Galeva N. Direct Identification of Cytochrome P450 Isozymes by Matrix-assisted Laser Desorption/Ionization Time of Flight-Based Proteomic Approach // Drug Metabolism and Disposition. 2003. T. 31. No. 4. P. 351-355.
79. Galeva N., Altermann M. Comparison of one-dimensional and two-dimensional gel electrophoresis as a separation tool for proteomic analysis of rat liver microsomes: cytochromes P450 and other membrane proteins. // Proteomics. 2002. T. 2. No. 6. P. 713-22.
80. Gao M. h j\p. Large scale depletion of the high-abundance proteins and analysis of middle- and low-abundance proteins in human liver proteome by multidimensional liquid chromatography. // Proteomics. 2008. T. 8. No. 5. P. 93947.
81. Garcia-Blanco M. a, Baraniak A. P., Lasda E. L. Alternative splicing in disease and therapy. // Nature biotechnology. 2004. T. 22. No. 5. P. 535-46.
82. Gatlin C.L. hap. Automated Identification of Amino Acid Sequence Variations in Proteins by HPLC/Microspray Tandem Mass Spectrometry // Analytical Chemistry. 2000. T. 72. No. 4. pp. 757-763.
83. Gobom J. h £p. A Calibration Method That Simplifies and Improves Accurate Determination of Peptide Molecular Masses by MALDI-TOF MS // Analytical Chemistry. 2002. T. 74. No. 15. P. 3915-3923.
84. Griss J. h ap. Published and Perished? the influence of the searched protein database on the long-term storage of proteomics data. // Molecular & cellular proteomics: MCP. 2011. T. 10. No. 9. C. Ml 11.008490.
85. Grone J. h ^p. Differential expression of genes encoding tight junction proteins in colorectal cancer: frequent dysregulation of claudin-1, -8 and -12. // International journal of colorectal disease. 2007. T. 22. No. 6. P. 651-9.
86. Hamosh A. h £p. Online Mendelian Inheritance in Man (OMIM), a knowledgebase of human genes and genetic disorders. // Nucleic acids research. 2005. T. 33. No. Database issue. C. D514-7.
87. Hamosh A. h ap. Online Mendelian Inheritance in Man (OMIM). // Human mutation. 2000. T. 15. No. 1. P. 57-61.
88. Han X., Aslanian A., Yates III J.R. Mass spectrometry for proteomics // Current Opinion in Chemical Biology. 2008. T. 12. No. 5. P. 483-490.
89. Hedden P. h ap. Gibberellin Biosynthesis in Plants and Fungi: A Case of Convergent Evolution? // Journal of plant growth regulation. 2001. T. 20. No. 4. P. 319-331.
90. Hopfgartner G. h Triple quadrupole linear ion trap mass spectrometer for the analysis of small molecules and macromolecules. // Journal of mass spectrometry: JMS. 2004. T. 39. No. 8. P. 845-55.
91. Huang Y. n flp. Statistical characterization of the charge state and residue dependence of low-energy CID peptide dissociation patterns. // Analytical chemistry. 2005. T. 77. No. 18. P. 5800-13.
92. Hubbard T. The Ensembl genome database project // Nucleic Acids Research. 2002. T. 30. No. 1. pp. 38-41.
93. Hustert E. h £p. The genetic determinants of the CYP3A5 polymorphism. // Pharmacogenetics. 2001. T. 11. No. 9. p. 773-9.
94. Ilina E.N. h ^p. Direct bacterial profiling by matrix-assisted laser desorption-ionization time-of-flight mass spectrometry for identification of pathogenic Neisseria. // The Journal of molecular diagnostics: JMD. 2009. T. 11. No. 1. P. 7586.
95. Ingelman-Sundberg M. Human drug metabolizing cytochrome P450 enzymes: properties and polymorphisms. // Naunyn-Schmiedeberg's archives of pharmacology. 2004. T. 369. No. 1. P. 89-104.
96. International Human Genome Sequencing Consortium. Finishing the euchromatic sequence of the human genome. //Nature. 2004. T. 431. No. 7011. P. 931 -45.
97. Ishihama Y. h pp. Exponentially modified protein abundance index (emPAI) for estimating absolute protein amount in proteomics by the number of sequenced peptides per protein. // Molecular & cellular proteomics: MCP. 2005. T. 4. No. 9. P. 1265-72.
98. Jain R., Wagner M. Kolmogorov-Smirnov scores and intrinsic mass tolerances for peptide mass fingerprinting. // Journal of proteome research. 2010. T. 9. No. 2. P. 737-42.
99. Jeffrey L. Cummings. Genotype-proteotype-phenotype relationships in neurodegenerative diseases. : Springer, 2005.
100. Jenkins R.E. hap. Relative and absolute quantitative expression profiling of P450 cytochromes using isotope-coded affinity tags. // Proteomics. 2006. T. 6. No. 6. P. 1934-47.
101. Jones P. h flp. PRIDE: a public repository of protein and peptide identifications for the proteomics community. // Nucleic acids research. 2006. T. 34. No. Database issue. C. D659-63.
102. Jones P. h flp. PRIDE: new developments and new datasets. // Nucleic acids research. 2008. T. 36. No. Database issue. C. D878-83.
103. Kalmar L. h jip. Mutation screening of the CI inhibitor gene among Hungarian patients with hereditary angioedema. // Human mutation. 2003. T. 22. No. 6. P. 498.
104. Keller A. h ap. Empirical Statistical Model To Estimate the Accuracy of Peptide Identifications Made by MS/MS and Database Search // Analytical Chemistry. 2002. T. 74. No. 20. P. 5383-5392.
105. Kersey P.J. n jjp. The International Protein Index: an integrated database for proteomics experiments. // Proteomics. 2004. T. 4. No. 7. P. 1985-8.
106. Kim S., Gupta N., Pevzner P. a. Spectral probabilities and generating functions of tandem mass spectra: a strike against decoy databases. // Journal of proteome research. 2008. T. 7. No. 8. P. 3354-63.
107. Klie S. h £p. Analyzing large-scale proteomics projects with latent semantic indexing. // Journal of proteome research. 2008. T. 7. No. 1. P. 182-91.
108. Kremer H. h up. Ichthyosis Bullosa of Siemens Is Caused by Mutations in the Keratin 2e Gene. // Journal of Investigative Dermatology. 1994. T. 103. No. 3. P. 286-289.
109. Kuehl P. h ap. Sequence diversity in CYP3A promoters and characterization of the genetic basis of polymorphic CYP3A5 expression. //Nature genetics. 2001. T. 27. No. 4. pp. 383-91.
110. Kuhn R.M. h up. The UCSC Genome Browser Database: update 2009. // Nucleic acids research. 2009. T. 37. No. Database issue. C. D755-61.
111. Kuster B. h flp. Mass spectrometry allows direct identification of proteins in large genomes. //Proteomics. 2001. T. 1. No. 5. p. 641-50.
112. Lane C.S. hap. Comparative cytochrome P450 proteomics in the livers of immunodeficient mice using 180 stable isotope labeling. // Molecular & cellular proteomics: MCP. 2007. T. 6. No. 6. P. 953-62.
113. Lane C.S. h ,qp. Identification of cytochrome P450 enzymes in human colorectal metastases and the surrounding liver: a proteomic approach. // European journal of cancer (Oxford, England: 1990). 2004. T. 40. No. 14. P. 2127-34.
114. Lane E.B., McLean W.H.I. Keratins and skin disorders. // The Journal of pathology. 2004. T. 204. No. 4. P. 355-66.
115. Levine a J. P53, the Cellular Gatekeeper for Growth and Division. // Cell. 1997. T. 88. No. 3. P. 323-31.
116. Levy S. h AP- The diploid genome sequence of an individual human. // PLoS biology. 2007. T. 5. No. 10. P. e254.
117. Lewis D.F.V. 57 varieties: the human cytochromes P450. // Pharmacogenomics. 2004. T. 5. No. 3. P. 305-18.
118. Lim A. h ap. Characterization of Transthyretin Variants in Familial Transthyretin Amyloidosis by Mass Spectrometric Peptide Mapping and DNA Sequence Analysis // Analytical Chemistry. 2002. T. 74. No. 4. P. 741-751.
119. Lim H. Identification of 2D-gel proteins: A comparison of MALDI/TOF peptide mass mapping to p LC-ESI tandem mass spectrometry // Journal of the American Society for Mass Spectrometry. 2003. T. 14. No. 9. P. 957-970.
120. Lisitsa A.V. h "p. Application of slicing of one-dimensional gels with subsequent slice-by-slice mass spectrometry for the proteomic profiling of human liver cytochromes P450. // Journal of protein research. 2010. T. 9. No. 1. P. 95-103.
121. Liu T. h ap. High dynamic range characterization of the trauma patient plasma proteome. // Molecular & cellular proteomics: MCP. 2006. T. 5. No. 10. P. 1899913.
122. Liu T. h/ip. Human Plasma N-Glycoproteome Analysis by Immunoaffinity Subtraction, Hydrazide Chemistry, and Mass Spectrometry // Journal of proteome research. 2005. T. 4. No. 6. pp. 2070-2080.
123. Mallick P. h flp. Computational prediction of proteotypic peptides for quantitative proteomics. //Nature biotechnology. 2007. T. 25. No. 1. P. 125-31.
124. Mann M., Jensen O.N. Proteomic analysis of post-translational modifications. // Nature biotechnology. 2003. T. 21. No. 3. P. 255-61.
125. Mann M., Wilm M. Error-Tolerant Identification of Peptides in Sequence Databases by Peptide Sequence Tags // Analytical Chemistry. 1994. T. 66. No. 24. pp. 4390-4399.
126. Marchetti A. h pp. Frequent mutations in the neurotrophic tyrosine receptor kinase gene family in large cell neuroendocrine carcinoma of the lung. // Human mutation. 2008. T. 29. No. 5. P. 609-16.
127. Marichal P. h Contribution of mutations in the cytochrome P450 14(alpha)-demethylase (Ergllp, Cyp51p) to azole resistance in Candida albicans // Microbiology. 1999. T. 145. No. 10. P. 2701-2713.
128. Martens L. h jxp. PRIDE: the proteomics identifications database. // Proteomics. 2005. T. 5. No. 13. pp. 3537-45.
129. Matthiesen R., Amorim A. Proteomics facing the combinatorial problem. // Methods in molecular biology (Clifton, N.J.). 2010. T. 593. pp. 175-86.
130. McDonald W.H., Yates J.R. Shotgun proteomics: integrating technologies to answer biological questions. // Current opinion in molecular therapeutics. 2003. T. 5. No. 3. P. 302-9.
131. Menon R., Omenn G.S. Proteomic characterization of novel alternative splice variant proteins in human epidermal growth factor receptor 2/neu-induced breast cancers. // Cancer research. 2010. T. 70. No. 9. P. 3440-9.
132. Menschaert G. h £p. Peptidomics coming of age: a review of contributions from a bioinformatics angle. // Journal of proteome research. 2010. T. 9. No. 5. P. 205161.
133. Millar D.S. h Three novel missense mutations in the antithrombin III (AT3) gene causing recurrent venous thrombosis. // Human genetics. 1994. T. 94. No. 5. P. 509-12.
134. Mironov A.A. Frequent Alternative Splicing of Human Genes // Genome Research. 1999. T. 9. No. 12. P. 1288-1293.
135. Modrek B. Genome-wide detection of alternative splicing in expressed sequences of human genes // Nucleic Acids Research. 2001. T. 29. No. 13. pp. 2850-2859.
136. Mueller M. h ap. Analysis of the experimental detection of central nervous system-related genes in human brain and cerebrospinal fluid datasets. // Proteomics. 2008. T. 8. No. 6. P. 1138-48.
137. Nagaraj S.H., Gasser R.B., Ranganathan S. A hitchhiker's guide to expressed sequence tag (EST) analysis. // Briefings in bioinformatics. 2007. T. 8. No. 1. P. 621.
138. Nedelkov D. Population proteomics: Investigation of protein diversity in human populations // Proteomics. 2008. T. 8. No. 4. P. 779-86.
139. Nedelkov D. h ap. High-throughput comprehensive analysis of human plasma proteins: a step toward population proteomics. // Analytical chemistry. 2004. T. 76. No. 6. P. 1733-7.
140. Nedelkov D. h ^p. Investigating diversity in human plasma proteins. // Proceedings of the National Academy of Sciences of the United States of America. 2005. T. 102. No. 31. P. 10852-7.
141. Nesvizhskii A.I. Protein identification by tandem mass spectrometry and sequence database searching. // Methods in molecular biology (Clifton, N.J.). 2007. T. 367. pp. 87-119.
142. Nesvizhskii A.I., Vitek O., Aebersold R. Analysis and validation of proteomic data generated by tandem mass spectrometry // Nature Methods. 2007. T. 4. No. 10. P. 787-797.
143. Ng P.C. hflp. Genetic Variation in an individual human exome // PLoS Genetics. 2008. T. 4. No. 8.
144. Ong S.-E., Mann M. Mass spectrometry-based proteomics turns quantitative. // Nature chemical biology. 2005. T. 1. No. 5. p. 252-62.
145. Ossipova E., Fenyô D., Eriksson J. Optimizing search conditions for the mass fingerprint-based identification of proteins. // Proteomics. 2006. T. 6. No. 7. P. 2079-85.
146. Overbeek R. h, np. Annotation of bacterial and archaeal genomes: improving accuracy and consistency. // Chemical reviews. 2007. T. 107. No. 8. P. 3431-47.
147. Pedrioli P.G.A. Trans-proteomic pipeline: a pipeline for proteomic analysis. // Methods in molecular biology (Clifton, N.J.). 2010. T. 604. pp. 213-38.
148. Perkins D.N. h ^p. Probability-based protein identification by searching sequence databases using mass spectrometry data // Electrophoresis. 1999. T. 20. No. 18. pp. 3551-3567.
149. Perry D.J., Carrell R.W. Molecular genetics of human antithrombin deficiency. // Human mutation. 1996. T. 7. No. 1. P. 7-22.
150. Petrak J. h ap. Déjà vu in proteomics. A hit parade of repeatedly identified differentially expressed proteins. // Proteomics. 2008. T. 8. No. 9. P. 1744-9.
151. Pevzner P.A. h/ip. Efficiency of database search for identification of mutated and modified proteins via mass spectrometry. // Genome research. 2001. T. 11. No. 2. P. 290-9.
152. Porter C.J., Talbot C.C., Cuticchia A.J. Central mutation databases-a review. // Human mutation. 2000. T. 15. No. 1. P. 36-44.
153. Rabilloud T., Hochstrasser D., Simpson R.J. Is a gene-centric human proteome project the best way for proteomics to serve biology? // Proteomics. 2010. pp. 1-6.
154. Rapsilber J. h £p. Large-scale proteomic analysis of the human spliceosome. // Genome research. 2002. T. 12. No. 8. P. 1231-45.
155. Redlich G. h zip. Distinction between human cytochrome P450 (CYP) isoforms and identification of new phosphorylation sites by mass spectrometry. // Journal of proteome research. 2008. T. 7. No. 11. P. 4678-88.
156. Reid G.E., McLuckey S.A. "Top down" protein characterization via tandem mass spectrometiy. // Journal of mass spectrometry: JMS. 2002. T. 37. No. 7. P. 663-75.
157. Rodriguez C. h zip. Proteotyping of human haptoglobin by MALDI-TOF profiling: Phenotype distribution in a population of toxic oil syndrome patients. // Proteomics. 2006. T. 6. C. S272--81.
158. Roher A. h zip. Structural alterations in the peptide backbone of beta-amyloid core protein may account for its deposition and stability in Alzheimer's disease // J. Biol. Chem. 1993. T. 268. No. 5. pp. 3072-3083.
159. Rostami-Hodjegan A., Tucker G.T. Simulation and prediction of in vivo drug metabolism in human populations from in vitro data. // Nature reviews. Drug discovery. 2007. T. 6. No. 2. P. 140-8.
160. Roth M.J. h zip. "Proteotyping": population proteomics of human leukocytes using top down mass spectrometry. // Analytical chemistry. 2008. T. 80. No. 8. P. 285766.
161. Rozman D., Waterman M.R. Lanosterol 14alpha -Demethylase (CYP51) and Spermatogenesis // Drug Metab. Dispos. 1998. T. 26. No. 12. P. 1199-1201.
162. Rubina A.Y. h zip. Why 3-D? Gel-based microarrays in proteomics. // Proteomics. 2008. T. 8. No. 4. pp. 817-31.
163. Sadygov R.G., Cociorva D., Iii J.R.Y. Large-scale database searching using tandem mass spectra: Looking up the answer in the back of the book // Nature Methods. 2004. T. 1. No. 3. P. 195-202.
164. Sarkozy A. h zip. Germline BRAF mutations in Noonan, LEOPARD, and cardiofaciocutaneous syndromes: molecular diversity and associated phenotypic spectrum. // Human mutation. 2009. T. 30. No. 4. P. 695-702.
165. Sattelle D.B., Jones A.K., Buckingham S.D. Insect genomes: challenges and opportunities for neuroscience. // Invertebrate neuroscience: IN. 2007. T. 7. No. 3. P. 133-6.
166. Schandorff S. h, np. A mass spectrometry-friendly database for cSNP identification. //Nature methods. 2007. T. 4. No. 6. P. 465-6.
167. Schmuth M. h Ichthyosis update: towards a function-driven model of pathogenesis of the disorders of cornification and the role of corneocyte proteins in these disorders. //Advances in dermatology. 2007. T. 23. pp. 231-56.
168. Schweigert F.J., Wirth K., Raila J. Characterization of the microheterogeneity of transthyretin in plasma and urine using SELDI-TOF-MS immunoassay. // Proteome science. 2004. T. 2. No. 1. P. 5.
169. Searle B.C., Turner M., Nesvizhskii A.I. Improving sensitivity by probabilistically combining results from multiple MS/MS search methodologies. // Journal of proteome research. 2008. T. 7. No. 1. P. 245-53.
170. Seo J., Lee K.-J. Post-translational modifications and their biological functions: proteomic analysis and systematic approaches. // Journal of biochemistry and molecular biology. 2004. T. 37. No. 1. pp. 35-44.
171. Sherry S.T. dbSNP: the NCBI database of genetic variation // Nucleic Acids Research. 2001. T. 29. No. 1. P. 308-311.
172. Shevchenko A. h j\p. Mass Spectrometric Sequencing of Proteins from Silver-Stained Polyacrylamide Gels // Analytical Chemistry. 1996. T. 68. No. 5. P. 850858.
173. Shi W.-feng h up. Proteotyping: A new approach studying influenza virus evolution at the protein level // Virologica Sinica. 2008. T. 22. No. 5. P. 405-411.
174. Shteynberg D. h np. iProphet: Multi-level integrative analysis of shotgun proteomic data improves peptide and protein identification rates and error estimates. // Molecular & cellular proteomics: MCP. 2011. C. Ml 11.007690-.
175. Smigielski E.M. dbSNP: a database of single nucleotide polymorphisms // Nucleic Acids Research. 2000. T. 28. No. 1. P. 352-355.
176. Srebrow A., Kornblihtt A.R. The connection between splicing and cancer. // Journal of cell science. 2006. T. 119. No. Pt 13. P. 2635-41.
177. Stamm S. h zip. ASD: a bioinformatics resource on alternative splicing. // Nucleic acids research. 2006. T. 34. No. Database issue. C. D46-55.
178. Stein P.E., Carrell R.W. What do dysfunctional serpins tell us about molecular mobility and disease? // Nature Structural Biology. 1995. T. 2. No. 2. P. 96-113.
179. Supek F. n zip. Enhanced analytical power of SDS-PAGE using machine learning algorithms. //Proteomics. 2008. T. 8. No. 1. P. 28-31.
180. Taylor C.F. Minimum reporting requirements for proteomics: a MIAPE primer. // Proteomics. 2006. T. 6 Suppl 2. pp. 39-44.
181. Taylor C.F. h zip. The minimum information about a proteomics experiment (MIAPE). // Nature biotechnology. 2007. T. 25. No. 8. P. 887-93.
182. Thiede B. h zip. Peptide mass fingerprinting. // Methods (San Diego, Calif.). 2005. T. 35. No. 3. P. 237-47.
183. Tsvetkov P.O. h zip. Isomerization of the Asp7 residue results in zinc-induced oligomerization of Alzheimer's disease amyloid beta(l-16) peptide. // Chembiochem: a European journal of chemical biology. 2008. T. 9. No. 10. P. 1564-7 .
184. Uhlen M. h zip. A human protein atlas for normal and cancer tissues based on antibody proteomics. // Molecular & cellular proteomics: MCP. 2005. T. 4. No. 12. P. 1920-32.
185. Ullrich A. h zip. CANCER-RELATED PROTEIN KINASES // US Patent App. 12/. 2007.
186. Venter J.C. h zip. The sequence of the human genome. // Science (New York, N.Y.). 2001. T. 291. No. 5507. P. 1304-51.
187. Vizcaino J.A., Foster J.M., Martens L. Proteomics data repositories: Providing a safe haven for your data and acting as a springboard for further research // Journal of Proteomics. 2010. pp. 1-11.
188. W Vogel K. h zip. Developing assays for kinase drug discovery where have the advances come from? // 2007.
189. Westlind-Johnsson A. Comparative analysis of CYP3A expression in human liver suggests only a minor role for CYP3A5 in drug metabolism // Drug Metabolism and Disposition. 2003. T. 31. No. >6. pp. 755-761.
190. Wheeler D.L. h zip. Database resources of the National Center for Biotechnology Information. //Nucleic acids research. 2007. T. 35. No. Database issue. C. D5-12.
191. Whibley C., Pharoah P.D.P., Hollstein M. p53 polymorphisms: cancer implications. //Nature reviews. Cancer. 2009. T. 9. No. 2. P. 95-107.
192. Wilkins M.R. h/ip. From Proteins to Proteomes: Large Scale Protein Identification by Two-Dimensional Electrophoresis and Amino Acid Analysis // Bio/Technology. 1996. T. 14. No. 1. P. 61-65.
193. Wu C.H. hap. The Universal Protein Resource (UniProt): an expanding universe of protein information. // Nucleic acids research. 2006. T. 34. No. Database issue. C. D187-91.
194. Yates J R., Eng J. K., McCormack A. L. Mining Genomes: Correlating Tandem Mass Spectra of Modified and Unmodified Peptides to Sequences in Nucleotide Databases // Analytical Chemistry. 1995. T. 67. No. 18. P. 3202-3210.
195. Yip Y.L. h Annotating single amino acid polymorphisms in the UniProt/Swiss-Prot knowledgebase. // Human mutation. 2008. T. 29. No. 3. P. 3616.
196. Zanger U.M. hap. Polymorphic CYP2B6: molecular mechanisms and emerging clinical significance. //Pharmacogenomics. 2007. T. 8. No. 7. P. 743-59.
197. Zgoda V.G. h £p. Proteomics of mouse liver microsomes: performance of different protein separation workflows for LC-MS/MS. // Proteomics. 2009. T. 9. No. 16. P. 4102-5.
198. Zhou H. h ap. Quantitative proteome analysis by solid-phase isotope tagging and mass spectrometry. //Nature biotechnology. 2002. T. 20. No. 5. P. 512-5.
199. Zubarev R.A., Zubarev A.R., Savitski M.M. Electron capture/transfer versus collisionally activated/induced dissociations: solo or duet? // Journal of the American Society for Mass Spectrometry. 2008. T. 19. No. 6. P. 753-61.
Please note that the scientific texts presented above are posted for informational purposes only and were obtained through original dissertation text recognition (OCR). Therefore, they may contain errors associated with imperfect recognition algorithms. There are no such errors in the PDF files of dissertations and abstracts that we deliver.
The book is the first textbook in Russian on the basics of mass spectrometry of proteins and peptides. The purpose of this publication is to interest young researchers in an informative, beautiful and in demand discipline all over the world, to provide an opportunity to more effectively use mass spectrometry to solve fundamental and applied scientific problems. The book is written in a lecture format for beginners, well illustrated and accompanied by a representative list of cited literature.
The publication is intended for undergraduate and graduate students of chemical, physical-chemical, biological and medical specialties; will be useful to researchers already working in the field of protein and peptide research or interested in this scientific area.
| 7 | ||
| Abbreviations used | 9 | |
| Introduction | 11 | |
| Chapter 1. Methods for ionization of peptide and protein molecules | 14 | |
| 1.1. Fast Atom Bombardment (FAB) | 14 | |
| 1.2. Matrix-assisted laser desorption/ionization, MALDI (Martix Assisted Laser Desorption/Ionization, MALDI) 16 | ||
| 1.3. Electrospray Ionization (ESI) | 19 | |
| Chapter 2: Measuring the Molecular Weight of Peptides and Proteins | 25 | |
| Chapter 3. Establishment of the primary structure of peptides | 34 | |
| 3.1. Edman degradation | 34 | |
| 3.2. Identification of peptides by cDNA sequence | 36 | |
| 3.3. Ladder sequencing | 37 | |
| Chapter 4. Mass Spectrometric Sequencing | 39 | |
| 4.1. Peptide fragment ion nomenclature | 39 | |
| 4.2. Negative ion mass spectra | 45 | |
| 4.3. Methods for initiating fragmentation of molecular ions 46 | ||
| 4.3.1. Collisionally Activated Dissociation (CAD) | 47 | |
| 4.3.2. Surface Induced Dissociation (SID) | 56 | |
| 4.3.3. Electron Capture Dissociation (ECD) | 59 | |
| 4.3.4. Electron Transfer Dissociation, ETD | 64 | |
| 4.3.5. Photoactivation dissociation | 65 | |
| 4.3.6. Electron-activated dissociation | 69 | |
| 4.3.7. Dissociation of negative ions upon electron abstraction | 70 | |
| 4.4. Methods for sequencing peptides using matrix-assisted laser desorption/ionization devices | 71 | |
| 4.4.1. Delayed extraction method. Decay in the source, RVI (In Source Decay, ISD) | 71 | |
| 4.4.2. Decay outside the source, PSD (Post Source Decay, PSD) | 72 | |
| Chapter 5. Identification of Proteins and Peptides | 7 6 | |
| 5.1. Identification using databases | 76 | |
| 5.1.1. Bottom-up protein identification method | 76 | |
| 5.1.2. Top-down protein identification method | 91 | |
| 5.2. Manual peptide identification | 94 | |
| Chapter 6. The main difficulties of mass spectrometric sequencing of peptides and ways to overcome them | 97 | |
| 6.1. Sequence coverage | 98 | |
| 6.2. Amino acids with the same whole number mass | 102 | |
| 6.2.1. Lysine and glutamine | 102 | |
| 6.2.2. Phenylalanine and oxidized methionine | 104 | |
| 6.3. Isomeric amino acids: leucine and isoleucine | 106 | |
| 6.4. Cyclization of short peptides | 108 | |
| 6.5. Peptides containing a disulfide bond | 116 | |
| Chapter 7: Using Mass Spectronegative Ions for Sequencing | 121 | |
| Chapter 8. Quantitative analysis of proteins using high-performance liquid chromatography-mass spectrometry. Quantitative proteomics | 126 | |
| 8.1. Comparative (quantitative) proteomics | 129 | |
| 8.1.1. Isotope-free method | 129 | |
| 8.1.2. Isotope methods | 132 | |
| 8.2. Establishing absolute quantities | 145 | |
| Bibliography | 149 | |
| Application. Bruker: A multidimensional path to unraveling the proteome | 163 | |
Preface
Dedicated
professors of the Faculty of Chemistry
Moscow State University named after M.V. Lomonosov
Alexander Leonidovich Kurts
Kim Petrovich Butin
The most important achievements of mass spectrometry over the past 20 years are associated with the study of natural compounds, including biopolymers. With the advent of electrospray ionization and matrix-assisted laser desorption/ionization techniques, sugars, nucleic acids, proteins, lipids, and other bioorganic macromolecules have become available for mass spectrometry. Of course, the greatest successes have been achieved in the study of proteins. Thanks to its sensitivity, information content, expressness, and the ability to work with mixtures, mass spectrometry today is the main method for analyzing these difficult-to-study objects.
Perhaps, we can admit that modern mass spectrometry has won the competition with the classical method of establishing the primary sequence of amino acids in peptides according to Edman, since mass spectrometric sequencing turned out to be significantly faster, more sensitive, more informative and even cheaper. Fast and reliable determination of the primary structure of proteins, i.e. sequence of amino acid units, in itself is an excellent result. However, mass spectrometry is capable of studying structures of more complex orders (from 2 to 4), including non-covalent interactions of proteins with the appearance of supra-protein formations, establishing the type and location of post-translational modifications, working with glycoproteins, lipoproteins, phosphoproteins, etc. Mass spectrometry has become indispensable in medicine because it can quickly and reliably diagnose cardiovascular, genetic and oncological diseases. It was the successes of mass spectrometry that led to the formation of a new scientific direction - proteomics - at the end of the last century. The role of the method in metabolomics is also enormous.
Unfortunately, in Russian-language literature there have not yet been any textbooks or monographs on this most important and multifaceted topic. Russia is fundamentally behind developed countries both in the study of this discipline and in the use of its achievements. Mass spectrometrists working in Russia have to rely on English-language editions of books, original articles and reviews. In 2012, the book “Principles of mass spectrometry as applied to biomolecules” was published in Russian, edited by J. Laskin and X. Lifshitz (translation from English, Technosphere publishing house), which is a collection of articles by leading experts in the field mass spectrometry as applied to biology. The book is intended for advanced readers. She provides
a good, in many respects, correspondence opportunity to get acquainted with modern achievements in the field of mass spectrometry of biomolecules, since most of the methods described in it are not yet used in our country.
The book “Fundamentals of mass spectrometry of proteins and peptides” offered to readers is the first textbook in Russian that sets out the fundamentals of mass spectrometry of proteins and peptides. The book is written in the format of lectures for beginners, illustrated with a large number of drawings, spectra, diagrams and is accompanied by a representative list of cited literature. It is designed for undergraduate and graduate students of chemical, physical-chemical, biological and medical specialties; will be useful to researchers already working in the field of protein and peptide research or interested in this scientific area.
The purpose of publishing such a book is to interest young researchers in an informative, very beautiful and in demand discipline all over the world, to provide an opportunity to more effectively use mass spectrometry to solve their own fundamental and applied scientific problems.
The textbook focuses on methods of ionization of proteins and peptides, and the processes of fragmentation of these compounds in the gas phase. The issues of tandem mass spectrometry and existing methods for initiating fragmentation are discussed in sufficient detail. This section is very important in modern mass spectrometry. It is useful for researchers working with any chemical compounds and biopolymers. Several chapters are devoted to the identification of proteins and peptides. This includes options for automated identification, manual interpretation of spectra, and a description of certain difficulties in mass spectrometric sequencing and options for overcoming them. The advantages and disadvantages of two main approaches to establishing the chemical structure of proteins are considered: “top-down” and “bottom-up” mass spectrometry. A separate chapter is devoted to issues of quantitative analysis.
The book is dedicated to Alexander Leonidovich Kurtz and Kim Petrovich Butin, two friends, wonderful professors of the Faculty of Chemistry of Moscow State University named after M.V. Lomonosov, very close to us in human terms, directly involved in our chemical and humanitarian education. We have always highly appreciated the chemical erudition and amazing personal qualities of these scientists. It was communication with these people that inspired us to begin research in the field of peptide mass spectrometry at the very beginning of the 21st century.
A.T. Lebedev
K.A. Artemenko
T.Yu. Samgina
The most characteristic physicochemical properties of proteins are: high viscosity of solutions, insignificant diffusion, ability to swell within large limits, optical activity, mobility in an electric field, low osmotic pressure and high oncotic pressure, ability to absorb UV rays at 280 nm (this the latter property, due to the presence of aromatic amino acids in proteins, is used for the quantitative determination of proteins).
Proteins, like amino acids, are amphoteric due to the presence of free NH2 and COOH groups and are characterized accordingly by all the properties of acids and bases.
Proteins have pronounced hydrophilic properties. Their solutions have very low osmotic pressure, high viscosity and low diffusion ability. Proteins are capable of swelling within very large limits.
A number of characteristic properties are associated with the colloidal state of proteins, in particular the phenomenon of light scattering, which underlies the quantitative determination of proteins by nephelometry. This effect is also used in modern methods of microscopy of biological objects. Protein molecules are not able to pass through semi-permeable artificial membranes (cellophane, parchment, collodion), as well as biomembranes of plant and animal tissues, although with organic lesions, such as the kidneys, the capsule of the renal glomerulus (Shumlyansky-Bowman) becomes permeable to serum albumin, and they appear in the urine.
Protein denaturation under the influence of various physical and chemical factors causes proteins to coagulate and precipitate, losing their native properties. Thus, denaturation should be understood as a violation of the general plan - the unique structure of the native protein molecule, leading to the loss of its characteristic properties (solubility, electrophoretic mobility, biological activity, etc.). Most proteins are denatured when they are heated with a solution above 50-60o C. External manifestations of denaturation are reduced to loss of solubility, especially at the isoelectric point, an increase in the viscosity of protein solutions, an increase in the amount of free functional SH-rpypp and a change in the nature of x-ray scattering. The most characteristic sign of denaturation is a sharp decrease or complete loss of a protein’s biological activity (catalytic antigenic or hormonal). During denaturation, mainly non-covalent (in particular, hydrogen) bonds and disulfide bridges are destroyed and the peptide bonds of the very backbone of the polypeptide chain are not affected. In this case, globules of native ones unfold protein molecules and random and disordered structures are formed.
salting out: precipitation with salts of alkali, alkaline earth metals (sodium chloride, magnesium sulfate), ammonium sulfate; the primary structure of the protein is not disrupted;
deposition: use of water-removing substances: alcohol or acetone at low temperatures (about –20 С).
When using these methods, proteins lose their hydration shell and precipitate in solution.
Denaturation- violation of the spatial structure of proteins (the primary structure of the molecule is preserved). It can be reversible (the protein structure is restored after removing the denaturing agent) or irreversible (the spatial structure of the molecule is not restored, for example, when proteins are precipitated with concentrated mineral acids, salts of heavy metals).
Methods for protein separation Separation of proteins from low molecular weight impurities
Dialysis
A special polymer membrane is used, which has pores of a certain size. Small molecules (low molecular weight impurities) pass through the pores in the membrane, and large molecules (proteins) are retained. Thus, proteins are washed away from impurities.
Separation of proteins by molecular weight
Gel chromatography
The chromatographic column is filled with gel granules (Sephadex), which has pores of a certain size. A mixture of proteins is added to the column. Proteins whose size is smaller than the size of the Sephadex pores are retained in the column, as they are “stuck” in the pores, while the rest freely exit the column (Fig. 2.1). The size of a protein depends on its molecular weight.
Rice. 2.1. Protein separation by gel filtration
Ultracentrifugation
This method is based on different rates of sedimentation (precipitation) of protein molecules in solutions with different density gradients (sucrose buffer or cesium chloride) (Fig. 2.2).

Rice. 2.2. Separation of proteins by ultracentrifugation
Electrophoresis
This method is based on different rates of migration of proteins and peptides in an electric field depending on the charge.
Gels, cellulose acetate, and agar can serve as carriers for electrophoresis. Separated molecules move in the gel depending on their size: those that are larger will be delayed as they pass through the pores of the gel. Smaller molecules will encounter less resistance and therefore move faster. As a result, after electrophoresis, larger molecules will be closer to the start than smaller ones (Fig. 2.3).

Rice. 2.3. Protein separation by gel electrophoresis
Electrophoresis can also be used to separate proteins by molecular weight. For this they use PAGE electrophoresis in the presence of sodium dodecyl sulfate (SDS-Na).
Isolation of individual proteins
Affinity chromatography

The method is based on the ability of proteins to bind strongly to various molecules through non-covalent bonds. Used for the isolation and purification of enzymes, immunoglobulins, and receptor proteins.
Molecules of substances (ligands), to which certain proteins specifically bind, are covalently combined with particles of an inert substance. The protein mixture is added to the column, and the desired protein is firmly attached to the ligand. The remaining proteins leave the column freely. The retained protein can then be washed from the column using a buffer solution containing the free ligand. This highly sensitive method allows very small amounts of protein to be isolated in pure form from a cell extract containing hundreds of other proteins.
Isoelectric focusing
The method is based on different IET values of proteins. Proteins are separated by electrophoresis on a plate with ampholine (this is a substance in which a pH gradient in the range from 3 to 10 is pre-formed). During electrophoresis, proteins are separated according to their IET value (in IET, the charge of the protein will be zero, and it will not move in the electric field).
2D electrophoresis
It is a combination of isoelectric focusing and electrophoresis with SDS-Na. Electrophoresis is first carried out in the horizontal direction on a plate with ampholine. Proteins are separated according to charge (IET). Then the plate is treated with a SDS-Na solution and electrophoresis is carried out in the vertical direction. Proteins are separated based on molecular weight.
Immunoelectrophoresis (Western blot)
An analytical method used to identify specific proteins in a sample (Figure 2.4).
Isolation of proteins from biological material.
Separation of proteins by molecular weight by electrophoresis in PAGE with SDS-Na.
Transfer of proteins from the gel to a polymer plate to facilitate further work.
Treatment of the plate with a solution of nonspecific protein to fill the remaining pores.
Thus, after this stage, a plate is obtained, the pores of which contain separated proteins, and the space between them is filled with a nonspecific protein. Now we need to determine whether among the proteins there is the one we are looking for that is responsible for some disease. Antibody treatment is used for detection. Primary antibodies are antibodies to the protein of interest. Secondary antibodies mean antibodies to primary antibodies. An additional special label (the so-called molecular probe) is added to the secondary antibodies so that the results can then be visualized. A radioactive phosphate or enzyme tightly bound to a secondary antibody is used as a label. Binding first to primary and then to secondary antibodies has two purposes: standardization of the method and improvement of results.
Treatment with a solution of primary antibodies binding occurs in the place of the plate where the antigen (the desired protein) is located.
Removal of unbound antibodies (washing).
Treatment with a solution of labeled secondary antibodies for subsequent development.
Removal of unbound secondary antibodies (washing).

Rice. 2.4. Immunoelectrophoresis (Western blot)
If the desired protein is present in the biological material, a band appears on the plate, indicating the binding of this protein to the corresponding antibodies.